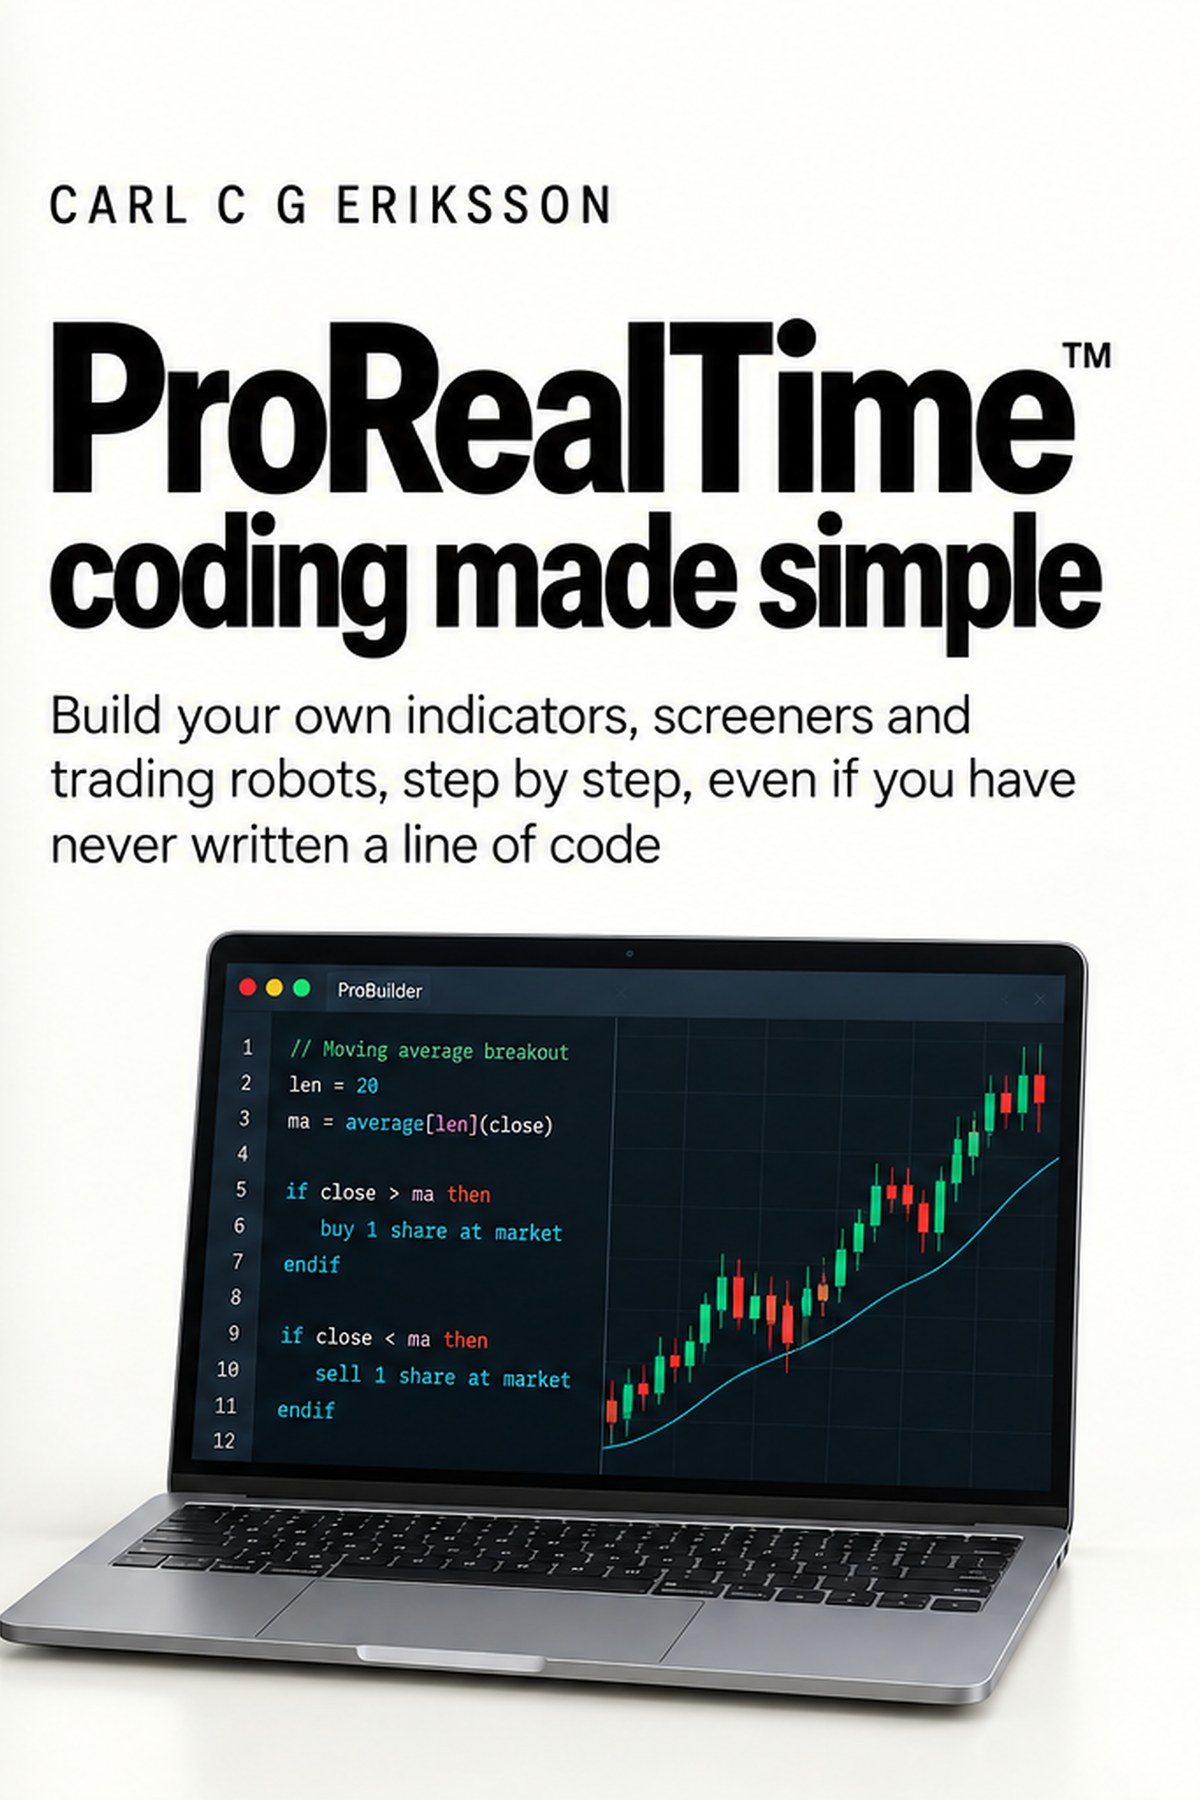
Los libros... aunque no gratis
Un máximo fractal inicia una línea de tendencia descendente, y una rotura en dos pasos de esa línea activa un buy stop 0.3 ATR(7) por encima del máximo reciente. Las salidas utilizan una banda exponencial y el RSI(2), cerrando los longs cuando el RSI está en 85 o más y el precio ha vuelto por debajo de la banda superior. Los shorts reflejan la misma lógica.
Mejor de 8 ejecuciones. USD/JPY, 4 horas, spread 1, de la ejecución sweeps:2026-09-17-USDJPY-4h-opt.tsv:2.
| Periodo | Hasta 2026-09-17 |
| Instrumento | USD/JPY, 4 horas |
| Spread | 1 puntos |
| Contratos | 1 |
| Capital inicial | 1,000,000 |
| Costes | Solo spread. No se incluyen comisiones ni financiación overnight. |
| Barras | Hasta 200,000 barras, menos cuando el instrumento tiene menos historial |
| Última prueba | 2026-09-17 |
| positionSize Contratos por operación | 1 |
| fractalBars Bars que el centro del fractal de 5 bars debe superar (estructural, mantener en 4) | 4 |
| breakoutBars Bars utilizados para el máximo o mínimo del breakout | 2 |
| atrPeriod Longitud del ATR para el margen de entrada | 7 |
| atrMultiplier Margen de entrada más allá del nivel de breakout, en ATR | 0.3 |
| bandPeriod Longitud de las bandas exponenciales de precio logarítmico | 34 |
| seedPeriod Longitud de la SMA utilizada para inicializar las bandas en los primeros bars | 3 |
| bandWidth Anchura de las bandas en desviaciones típicas | 1.618 |
| rsiPeriod Longitud del RSI para la salida | 2 |
| overboughtLevel Nivel de RSI que necesita la salida de un long | 85 |
| oversoldLevel Nivel de RSI que necesita la salida de un short | 15 |
| lookbackPeriod Ventana para el máximo y el mínimo del swing anterior | 100 |
Todas las ejecuciones
| Mercado | Marco temporal | PF | Operaciones | % de acierto | Neto | Max DD |
|---|---|---|---|---|---|---|
| USD/JPYMejor ejecución | 4 horas | n/a | 819 | 53.36 | 161,440 JPY | -93,910 |
| USD/JPY | Diario | n/a | 300 | 59.00 | 754,540 JPY | -174,840 |
| Nikkei 225 | Diario | n/a | 262 | 61.07 | 20,201 USD | -12,694 |
| Plata | Diario | n/a | 255 | 50.59 | 8,055 USD | -2,895 |
| Petróleo Brent | Diario | n/a | 119 | 60.50 | 4,755 EUR | -4,645 |
| GBP/USD | Diario | n/a | 334 | 59.88 | 3,432 USD | -2,003 |
| FTSE 100 | Diario | n/a | 297 | 54.55 | 2,325 EUR | -948 |
| Oro | Diario | n/a | 287 | 55.05 | 624 EUR | -317 |
Gráficos
El código
// ============================================================
// Trend Breakout
// ProRealAlgos Strategy Library  |  prorealalgos.com
// Type: Breakout
// Direction: Long & short
// Timeframe tested: 4 hours
// ============================================================

// --- Settings ---
DEFPARAM CumulateOrders = false

// --- Parameters ---
positionSize = 1          // contracts per trade
fractalBars = 4           // bars the centre of the 5-bar fractal must beat, keep at 4
breakoutBars = 2          // bars for the breakout high / low
atrPeriod = 7             // ATR length for the entry buffer
atrMultiplier = 0.3       // entry buffer beyond the breakout level, in ATRs
bandPeriod = 34           // length of the log-price exponential bands
seedPeriod = 3            // SMA used to seed the bands on early bars
bandWidth = 1.618         // band width in standard deviations
rsiPeriod = 2             // RSI length for the exit
overboughtLevel = 85      // long exit needs RSI at or above this
oversoldLevel = 15        // short exit needs RSI at or below this
lookbackPeriod = 100      // window for the prior swing high / low

// State, seeded so every value is defined on the first bar.
ONCE fractalHighCount = 0
ONCE fractalLowCount = 0
ONCE trendBreak = 0
ONCE bearSetup = 0
ONCE bullSetup = 0
ONCE fractalHigh = 0
ONCE fractalLow = 0
ONCE fractalBar = 0
ONCE trendHeight = 0
ONCE closeHeight = 0
ONCE maxAngle = 0
ONCE logEma = 0
ONCE logVariance = 0
ONCE longExitArmed = 0
ONCE shortExitArmed = 0

// --- Indicators ---
// Count how many of the last five bars the bar two back beats.
FOR i = 0 TO fractalBars DO
  IF high[2] > high[i] THEN
    fractalHighCount = fractalHighCount + 1
  ENDIF
  IF low[2] < low[i] THEN
    fractalLowCount = fractalLowCount + 1
  ENDIF
NEXT

// A fractal high starts a bearish trend line, a fractal low a bullish one.
IF fractalHighCount = fractalBars THEN
  IF bearSetup = 0 AND bullSetup = 0 THEN
    bearSetup = 1
  ENDIF
  fractalHigh = high[2]
  fractalBar = BarIndex - 2
ENDIF
IF fractalLowCount = fractalBars THEN
  IF bearSetup = 0 AND bullSetup = 0 THEN
    bullSetup = 1
  ENDIF
  fractalLow = low[2]
  fractalBar = BarIndex - 2
ENDIF
fractalHighCount = 0
fractalLowCount = 0

IF bearSetup = 1 THEN
  trendHeight = fractalHigh - high
  closeHeight = fractalHigh - close
ELSIF bullSetup = 1 THEN
  trendHeight = low - fractalLow
  closeHeight = close - fractalLow
ENDIF

// Track the steepest angle of the trend line from the fractal, then detect
// a two-step break of that line (trendBreak 1, then 2).
IF BarIndex - 2 = fractalBar THEN
  maxAngle = Tan(2 / trendHeight)
ENDIF
IF BarIndex - 2 > fractalBar THEN
  IF bearSetup = 1 THEN
    IF Tan((BarIndex - fractalBar) / trendHeight) > maxAngle AND (close < open OR close < close[1]) THEN
      maxAngle = Tan((BarIndex - fractalBar) / trendHeight)
      trendBreak = 0
    ENDIF
    IF trendBreak = 0 AND Tan((BarIndex - fractalBar) / closeHeight) > maxAngle AND close > open THEN
      trendBreak = 1
    ELSIF trendBreak = 1 AND Tan(((BarIndex - 1) - fractalBar) / closeHeight) > maxAngle AND close > close[1] THEN
      trendBreak = 2
    ENDIF
  ELSIF bullSetup = 1 THEN
    IF Tan((BarIndex - fractalBar) / trendHeight) > maxAngle AND (close > open OR close > close[1]) THEN
      maxAngle = Tan((BarIndex - fractalBar) / trendHeight)
      trendBreak = 0
    ENDIF
    IF trendBreak = 0 AND Tan((BarIndex - fractalBar) / closeHeight) > maxAngle AND close < open THEN
      trendBreak = 1
    ELSIF trendBreak = 1 AND Tan(((BarIndex - 1) - fractalBar) / closeHeight) > maxAngle AND close < close[1] THEN
      trendBreak = 2
    ENDIF
  ENDIF
ENDIF

atrValue = AverageTrueRange[atrPeriod](close)
67 líneas más: las reglas de entrada y salida.
Configuración
Preguntas
Sí, las entradas son órdenes stop pendientes válidas para un bar. El código se ha reescrito pero no se ha verificado en compilación, y las estadísticas son de la versión anterior.
Las siete filas fueron rentables. USD/JPY Diario ganó JPY 754,540 en 300 operaciones, y Nikkei 225 Diario ganó USD 20,201.20.
Con 1 contrato la mejor ejecución tuvo un max drawdown de JPY 93,910. Gold Diario fue mucho menor, con EUR 317.10.
Las líneas de tendencia dibujadas a partir de fractales necesitan suficientes bars entre los puntos de swing. Todas las filas probadas usaron bars de 4 horas o Diario.
Relacionado
La comunidad de ProRealAlgos obtiene las reglas completas, el código completo y la cartera automatizada.