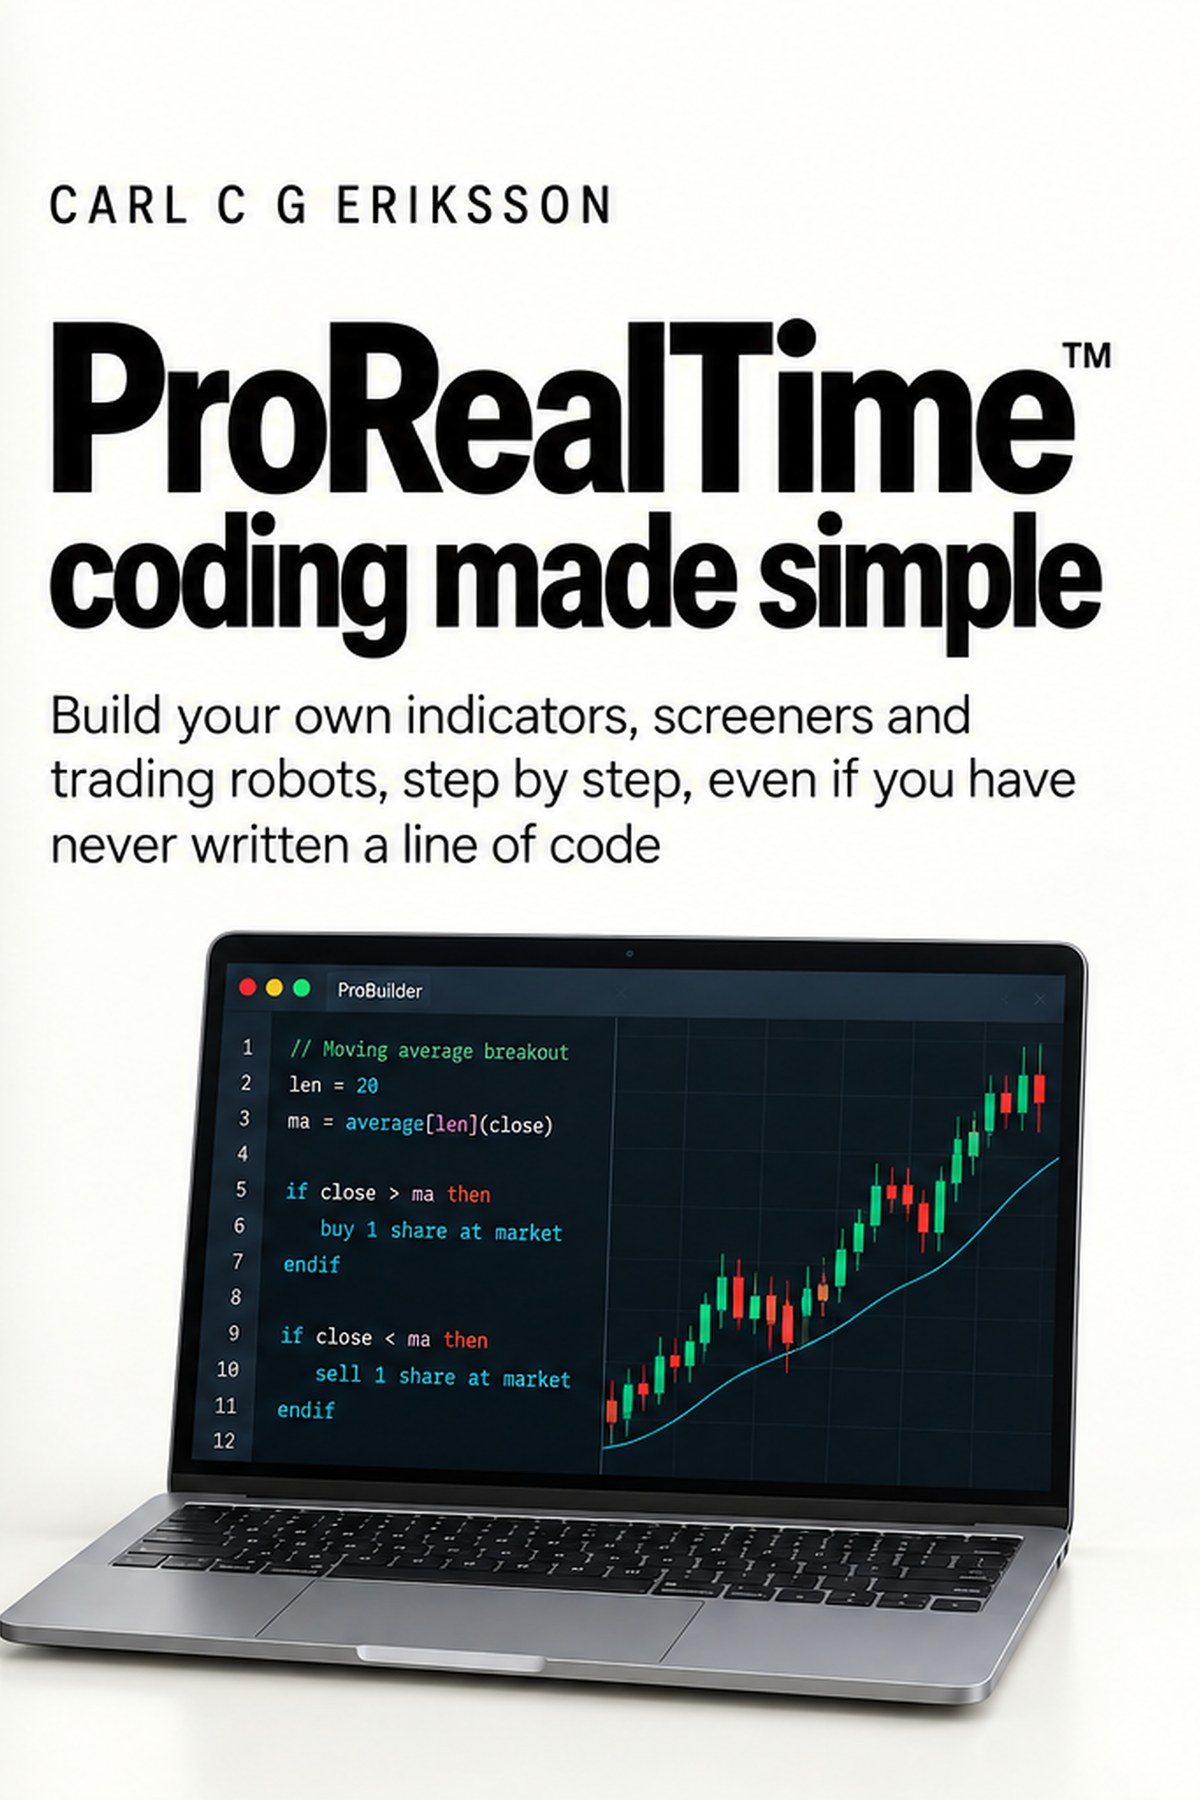
The books... not free though
The angle of a 10-period EMA over 15 bars must reach 45 or more for a long, or -37 or less for a short. A 20 EMA slope must also confirm against its signal line. Exits use percent targets, an ATR trailing stop and a time stop on losing trades.
Best run of 15. US Crude Oil, Daily, spread 3, from run pf:2026-09-15-CRUDE-D.tsv:2.
| Period | Up to 2026-09-15 |
| Instrument | US Crude Oil, Daily |
| Spread | 3 points |
| Contracts | 1 |
| Starting capital | 1,000,000 |
| Costs | Spread only. Commissions and overnight financing are not included. |
| Bars | Up to 200,000 bars, fewer where the instrument has less history |
| Last tested | 2026-09-16 |
| positionSize Contracts per long trade | 1 |
| shortSizeMultiplier Shorts trade this multiple of positionSize | 2 |
| anglePeriod EMA length for the angle | 10 |
| angleLookback Bars the angle is measured over | 15 |
| buyAngle Minimum angle for a long | 45 |
| sellAngle Maximum angle for a short | -37 |
| slopePeriod EMA length for the slope | 20 |
| slopeLookback Bars the slope is measured over | 35 |
| slopeLag Extra length for the slope's signal line | 5 |
| slopeSellFloor Shorts only while the slope is above this | -1 |
| longTargetPct Long profit target, percent | 4.25 |
| shortTargetPct Short profit target, percent | 1.25 |
| useTrailingStop 1 turns the trailing stop on | 1 |
| trailAtrPeriod ATR length for the trail distance | 25 |
| trailLongFactor Trail distance multiple for longs | 7.5 |
| trailShortFactor Trail distance multiple for shorts | 4 |
| atrPriceDivisor Price scaling inside the ATR input, as published | 10 |
| atrScaleDivisor Final ATR scaling, as published | 1000 |
| minStopPoints Minimum trail distance | 0 |
| maxBarsLong Close a losing long after this many bars | 950 |
| maxBarsShort Close a losing short after this many bars | 650 |
Every run
| Market | Timeframe | PF | Trades | Win % | Net | Max DD |
|---|---|---|---|---|---|---|
| US Crude OilBest run | Daily | 1.76 | 268 | 87.31 | 8,907 EUR | -4,158 |
| Silver | Daily | 1.62 | 205 | 81.46 | 10,550 USD | -4,229 |
| FTSE 100 | 4 hours | 1.34 | 374 | 80.75 | 5,627 EUR | -3,421 |
| DAX 40 | 4 hours | 1.33 | 398 | 80.90 | 11,668 EUR | -7,541 |
| Dow Jones | 1 hour | 1.29 | 460 | 65.43 | 24,708 EUR | -8,304 |
| Nikkei 225 | 4 hours | 1.19 | 331 | 83.08 | 14,346 USD | -12,547 |
| US Crude Oil | 30 min | 1.18 | 2,109 | 73.21 | 16,844 EUR | -4,602 |
| Nikkei 225 | 1 hour | 1.16 | 1,218 | 70.28 | 28,930 USD | -18,706 |
| S&P 500 | 5 min | 1.16 | 304 | 60.86 | 1,277 EUR | -921 |
| DAX 40 | 30 min | 1.14 | 1,997 | 60.39 | 16,845 EUR | -5,328 |
| Nikkei 225 | 30 min | 1.12 | 2,186 | 61.02 | 32,383 USD | -23,899 |
| Nasdaq 100 | 30 min | 1.11 | 1,417 | 65.07 | 10,901 EUR | -7,938 |
| Brent Crude | 30 min | 1.11 | 1,550 | 72.32 | 8,152 EUR | -6,335 |
| DAX 40 | 1 hour | 1.10 | 1,387 | 68.20 | 10,393 EUR | -9,180 |
| S&P 500 | 1 min | n/a | 53 | 52.83 | 569 EUR | -494 |
Charts
Top 10 of 15 runs. The full list is in the table above.
Above 1.0 made money, below 1.0 lost money.
The code
// ============================================================
// Vectorial Slope
// ProRealAlgos Strategy Library  |  prorealalgos.com
// Type: Momentum
// Direction: Long & short
// Timeframe tested: Daily
// ============================================================

// --- Settings ---
DEFPARAM CumulateOrders = false
DEFPARAM PreloadBars = 1000

// --- Parameters ---
positionSize = 1            // contracts per long trade
shortSizeMultiplier = 2     // shorts trade twice the long size
anglePeriod = 10            // EMA used for the angle
angleLookback = 15          // bars the angle is measured over
buyAngle = 45               // minimum angle for a long
sellAngle = -37             // maximum angle for a short
slopePeriod = 20            // EMA used for the slope
slopeLookback = 35          // bars the slope is measured over
slopeLag = 5                // extra length for the slope's signal line
slopeSellFloor = -1         // shorts only while the slope is above this
longTargetPct = 4.25        // long profit target, percent
shortTargetPct = 1.25       // short profit target, percent
useTrailingStop = 1         // 1 = trailing stop on
trailAtrPeriod = 25         // ATR length for the trail distance
trailLongFactor = 7.5       // trail distance multiple for longs
trailShortFactor = 4        // trail distance multiple for shorts
atrPriceDivisor = 10        // price scaling inside the ATR input, as published
atrScaleDivisor = 1000      // final scaling of the ATR, as published
minStopPoints = 0           // minimum trail distance
maxBarsLong = 950           // close a losing long after this many bars
maxBarsShort = 650          // close a losing short after this many bars

// --- Indicators ---
angleMA = ExponentialAverage[anglePeriod](close)
angleSlope = (angleMA - angleMA[angleLookback] * PipSize) / angleLookback
angleValue = ATAN(angleSlope)

slopeMA = ExponentialAverage[slopePeriod](close)
slopeValue = (slopeMA - slopeMA[slopeLookback] * PipSize) / slopeLookback
slopeSignal = ExponentialAverage[slopePeriod + slopeLag](slopeValue)

atrTrail = AverageTrueRange[trailAtrPeriod]((close / atrPriceDivisor) * PipSize) / atrScaleDivisor
trailDistanceLong = round(atrTrail * trailLongFactor)
trailDistanceShort = round(atrTrail * trailShortFactor)
63 more lines: the entry and exit rules.
Setup
Questions
Yes. The rewritten code has not been compile-checked, and the stats come from the pre-rewrite version.
Every row tested was profitable. US Crude Oil Daily had a profit factor of 1.76, Silver Daily 1.62 and DAX 40 4 hours 1.33.
At 1 contract for longs and 2 for shorts, the best run had a max drawdown of EUR 4,158. Nikkei 225 30 minutes reached USD 23,898.70.
Longs need a 45 angle and a 4.25% target, while shorts use -37 and 1.25%. The tested version treats down moves as shorter and sharper.
Related
The ProRealAlgos community gets the full rules, the complete code and the automated portfolio.